Taking stock on European airline emissions
by Robert Boyle,
SkiesFifty partner
European airlines are entering a new phase of climate-related financial exposure. With emissions rising back above pre-pandemic levels and EU ETS costs increasing sharply, decarbonisation is no longer just a reputational or regulatory issue, it is increasingly becoming material to financial performance. For sustainable aviation investors, understanding the dynamics of emissions, compliance costs, and relative airline performance is critical to assessing long-term resilience and alignment with transition pathways.
The EU launched the Emissions Trading System(ETS) back in 2005. The ETS was the world’s first carbon market, and it remains the largest today. Initially covering only power generation and energy-intensive industries, it was expanded to include aviation in 2012.However, only flights starting and finishing within the European Economic Area(EEA) were included, essentially short-haul flights only. I’ll come back later to the reasons why long-haul flights were excluded.
Initially, most airline emissions were covered by free allowances, but as the industry has grown and the free allowances have been phased out, an ever growing proportion of flights now have to pay for their full carbon costs. 25% of free allowances were phased out in 2024, 50% in2025 and there will be no free allowances at all in 2026.
Making aviation pay for its emissions could bethought of as having three objectives. Firstly, to incentivise efficiency. Secondly, to act as a drag on growth, with additional capacity being deployed only when it can cover the full costs including the cost of carbon. Finally, to provide a source of revenue which could be used to pay for emissions reductions in other sectors or perhaps increasingly to pay for the cost of climate adaptation measure. The “cap and trade” design of the system in theory delivered the first two objectives right from the outset. Since the free allowances are fixed, regardless of emissions levels, the full economic incentive for airlines to reduce or constrain their emissions was there from the start. It is only really the third objective of raising revenue that depended on the phase-out of the free allowances.
Before we take a look at what the track-record of the industry on emissions has been since its inclusion in ETS, I need to cover off a few annoying issues with the data.
Some technical notes
The figures which follow are based on aviation emissions for the EU and UK schemes added together, since originally they were one scheme but they split apart in 2021 following Brexit.
Flights to and from Switzerland have been included in ETS since 2020, but since we don’t have figures for earlier yearsI’ve done my best to exclude them for consistency. The only place where it is tricky to do that is for the UK ETS, since they don’t split out the Swiss figures. I’ve estimated an adjustment based on UK-Swiss ASKs as a percentage of all ETS eligible ASKs from the UK. It’s a small adjustment, but I like to make my data as clean as possible.
Although aviation was included in 2012, the actual figures for that year are all over the place. Maybe with enough work I could have cleaned them up, but I decided to look at a ten-year period starting in 2014, after the system had settled down a bit. In case you are worried, I haven’t been naughty and deliberately picked my base year - 2013 was about 2.5%below 2014 so the trends starting from then would have looked very similar.
Another issue with the emissions data is that the scope of the EU ETS was expanded in 2024 to include flights to the EU’s“outermost regions”, such as the Canary Islands, the Azores, Madeira and theFrench overseas territories. That led to about a 7% increase in reported emissions and so I’ve also shown the 2024 figures adjusted for that scope change in what follows.
Ten year perspective on emissions
So with all that data nerdiness out of the way, here is a chart showing how total emissions have developed over the the last ten years, excluding Switzerland. The red dotted line shows the 2024figures adjusted for the scope change that took place that year.
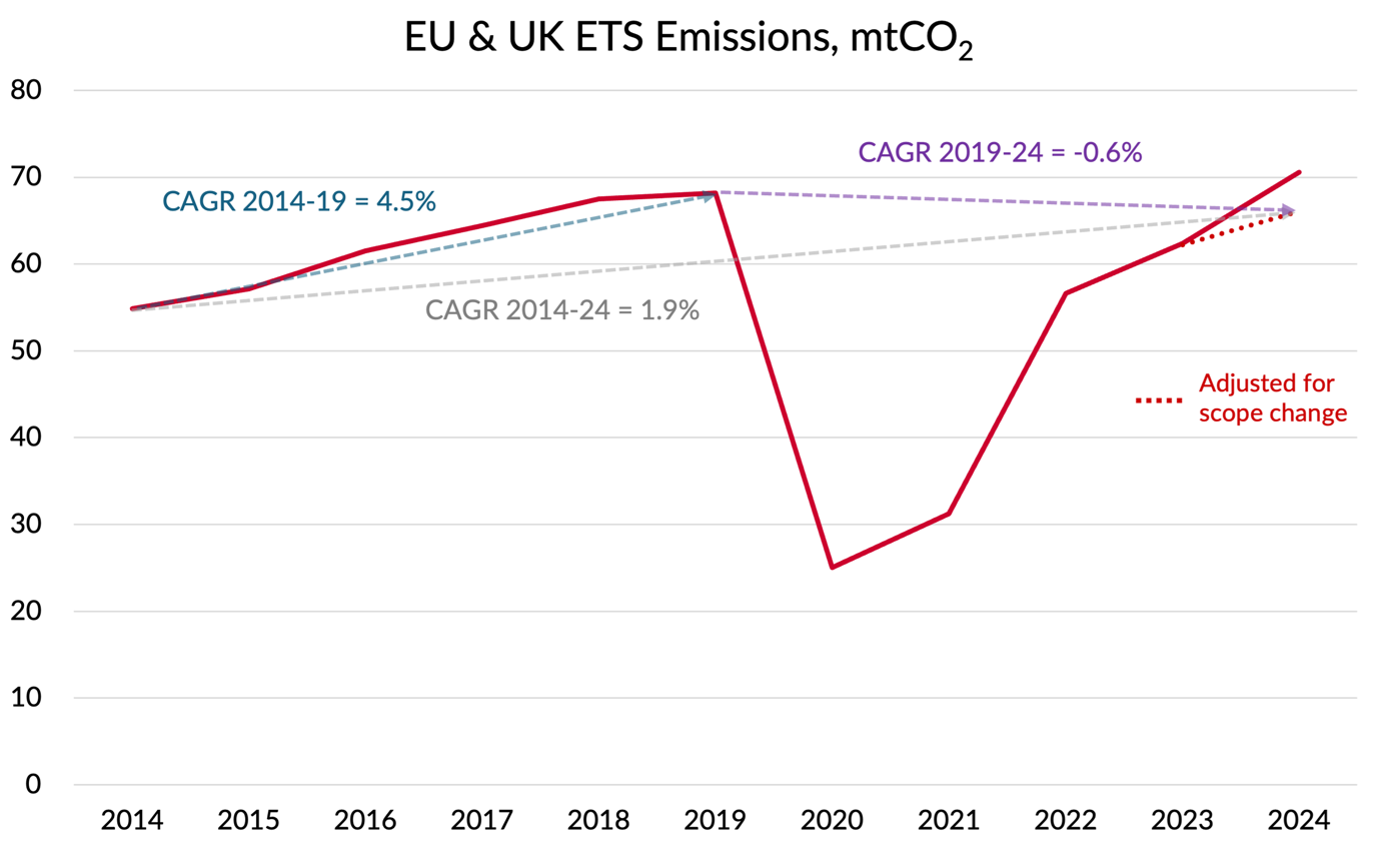
Source: EU and UK published data, GridPoint analysis
In the first five years, emissions grew at an average annual growth rate of 4.5%. That’s pretty strong growth for a mature market like Europe, so it doesn’t look like the ETS was acting as much of a brake on emissions growth.
Of course, not all of the emissions were being paid for in 2019, due to free allocations. But 57% of emissions were paid and with free allocations fixed regardless of activity, the incentive effect on airline decision-making should have been operating in full.
Part of the reason for the limited impact on growth undoubtedly lies in the carbon price that prevailed during those years of around €20 per tonne of carbon. Since a tonne of jet fuel produces 3.15tonnes of carbon, that equates to a fuel price increase of about $74. With jet prices around $800 per tonne, an effective 9% increase in the fuel price was always unlikely to show up as having much of an effect on demand.
The story over the last five years is far less clear, thanks to the COVID induced collapse. Five years on, emissions are still3% below 2019 levels, once you adjust for the change in ETS scope. But even on that basis, 2024 saw emissions increase by 6.4% compared to 2023. And that’s despite the 25% cut to free allowances.
Around 70% of ETS emissions were being paid for in 2024 and the price of carbon has risen to around €70 per tonne, equivalent to a fuel price increase of $260 per tonne for decisions “at the margin”. That’s a more meaningful increase in effective fuel prices (c. 30%),so perhaps has had more of an effect on demand. Some basic “fag-packet” economics might say that with fuel representing about 30% of revenue, a 30%increase in fuel costs might need prices to be about 9% higher. Using IATA’s-0.924 estimate of price elasticity for “whole market” price changes for the intra-European market would suggest a demand suppression of about 8%.
What about emissions efficiency?
While the ETS hasn’t in practice prevented emissions from growing, there is perhaps a stronger story on emissions efficiency. On the following chart, I’ve shown the same emissions data as an index (in red), together with the capacity flown as measured in ASK, again as an index (in blue).
The green line shows an index of the ratio of ASKs to Emissions, a crude but pretty good measure of emissions efficiency. You can see that during the 2014 to 2019 period, efficiency went up by 8%cumulatively, an improvement of 1.8% p.a. That rate of improvement increased to2.1% p.a. over the 2019 to 2024 period, leaving efficiency in 2024 up by 20%compared to ten years earlier. Quite impressive really, but not enough to offset the growth in capacity.
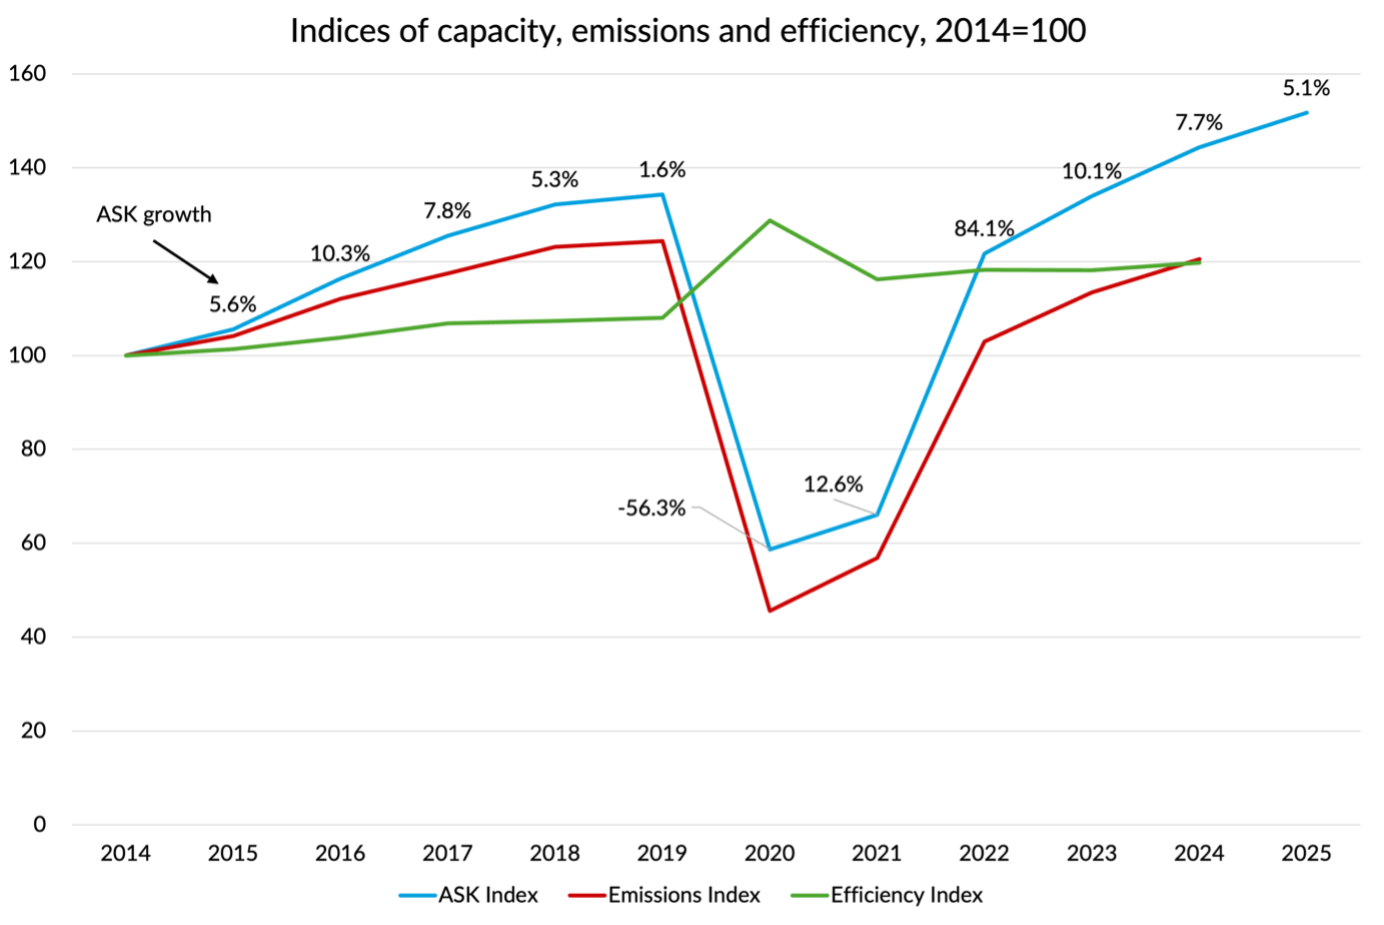
Source: Published schedule data, UK and EU emissions data, GridPoint analysis
One interesting thing to note from the chart is the big bump in efficiency during COVID. With overall demand suppressed, airlines grounded their oldest, least fuel efficient aircraft and only flew their newest and best. That effect got reversed of course as demand recovered and airlines began to bring most of their grounded planes back into operation.
The final point to note is that whilst 2025hasn’t finished yet, the published schedule data suggests that capacity covered by ETS will grow again by 5.1%. That’s not going to be offset by fuel efficiency gains, so emissions seem almost certain to rise again in 2025.
For investors, the scale and trajectory of ETS costs are now a fundamental part of the financial profile of European airlines.Carriers with limited hedging or higher exposure to short-haul intra-EU traffic may face disproportionate cost pressures, especially as free allowances phaseout entirely by 2026. These dynamics are likely to influence profitability, operating margins, and potentially credit ratings — all relevant to assessing long-term investment attractiveness.
What is the story by airline?
I’ve shown below the five year snapshots of emissions for the six biggest airline groups. I can’t easily adjust these figures for the 2024 scope change or eliminate the UK-Switzerland emissions, so some of the increases will be down to that. But I still think it gives a good overview of the composition of emissions by carrier.
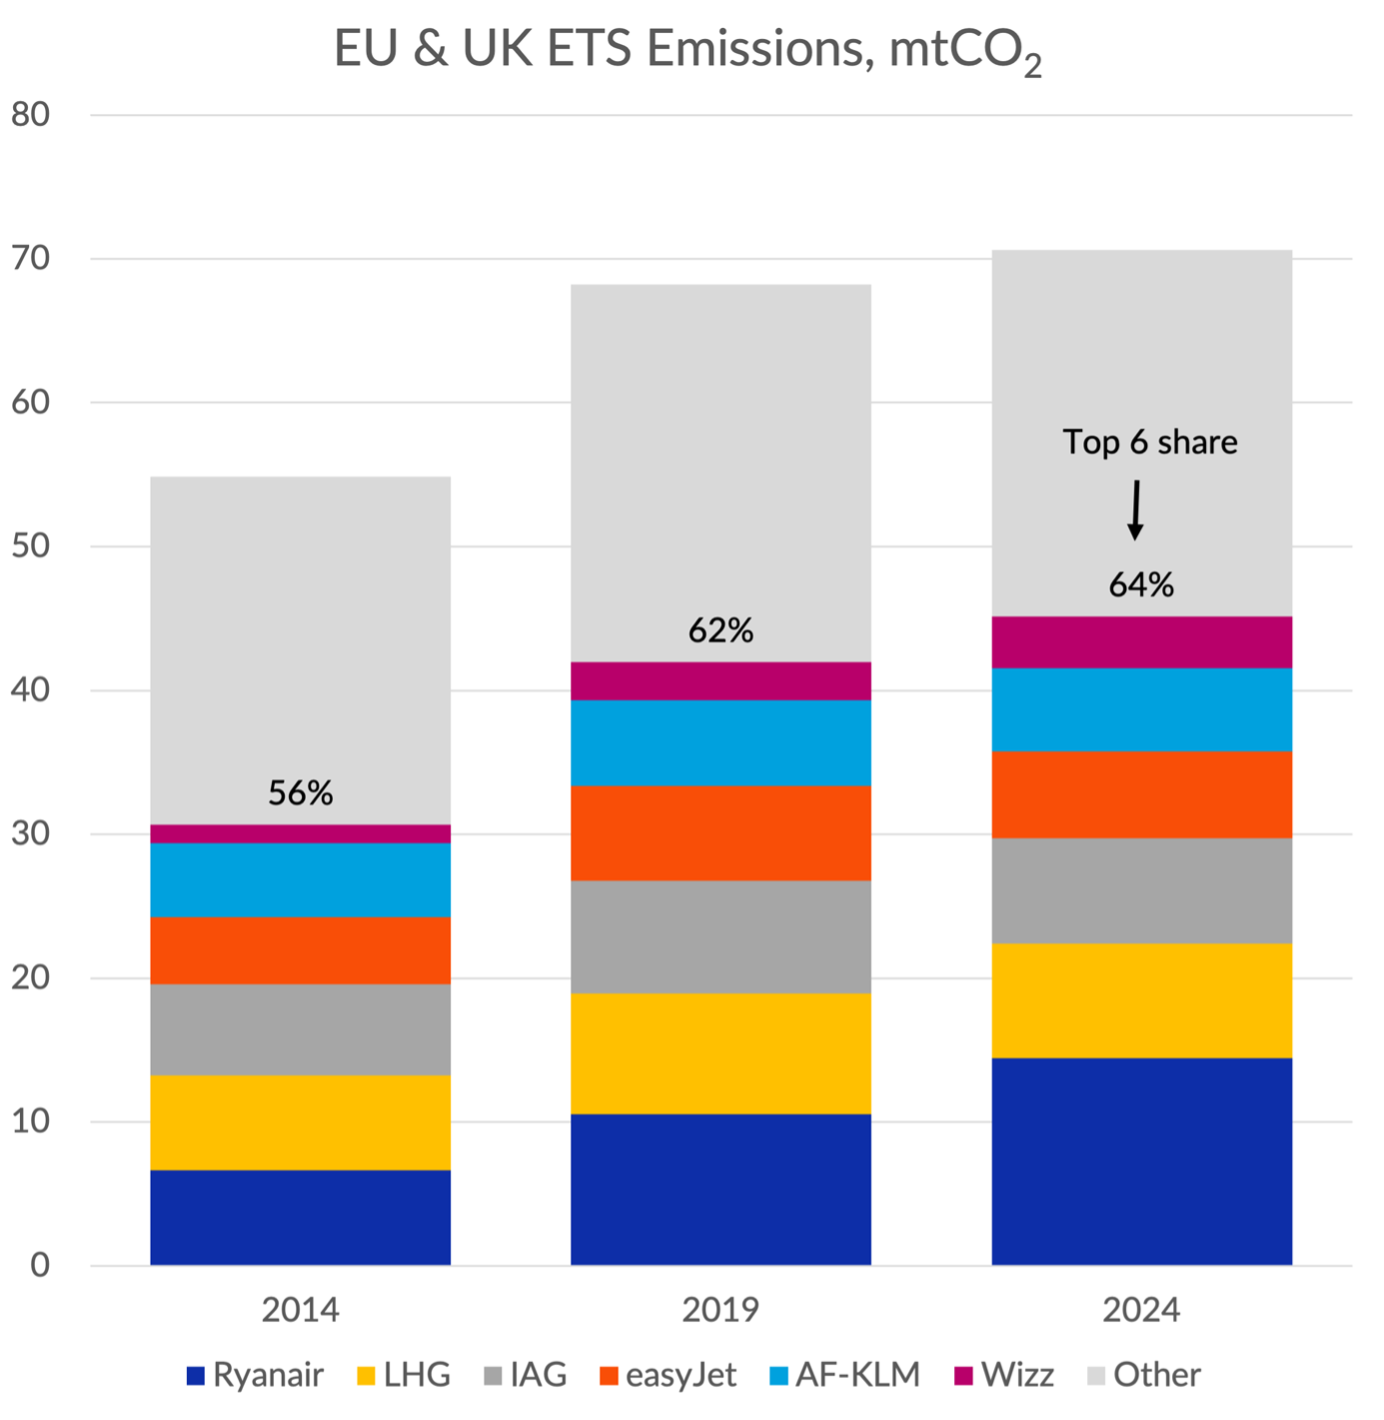
Source: EU and UK published data, GridPoint analysis
Considered over the entire 10-year period, all of the big six airline groups have grown their emissions and in aggregate they have increased their share of the total from 56% in 2014 to 65% in 2024. It shouldn’t come as a surprise that the largest and strongest airline groups have been growing their share of emissions. As we’ll see, weaker carriers have been going out of business, shrinking or being acquired by the stronger ones.
The big three network groups averaged growth over the 10 years of between 1 and 2% p.a. Since that’s lower than the overall growth, they actually represent a slightly lower percentage of emissions than they did ten years ago. Emissions grew a bit faster at easyJet. But their 2.6% average growth rate was actually quite in line with overall emissions growth.
By far the biggest contributors to short-haul emissions growth have been Ryanair (8.1% p.a. growth in emissions) and Wizz (11.0% p.a.). Ryanair has gone from 12.1% of all emissions in 2014 to 20.5% in2024. Wizz has gone from 2.3% to 5.0%. In fact, Ryanair alone is responsible for 50% of the absolute increase in emissions over the last ten years.
Both Wizz and Ryanair are very efficient in terms of emissions per passenger kilometre, flying relatively new aircraft in high density configurations. But whilst their fast growth is one of the big drivers of the improvement in the average emissions efficiency in Europe, the very rapid growth in their volume of flights has also driven a big increase in their absolute emissions. For investors, Ryanair and Wizz’s emissions growth raises important questions: are low-cost carriers structurally disadvantaged or better positioned in a world of rising carbon costs? Ryanair’s aggressive growth means its absolute emissions are rising fast, even as it maintains amongst the lowest emissions per passenger kilometre. This profile may appeal to investors focused on operational efficiency, but raises questions about how well this growth aligns with absolute decarbonisation pathways. Wizz continues to score relatively wellon intensity but shows the largest rebound in absolute emissions, which could reduce its appeal to investors with a strong focus on absolute emissions reduction.
The “other” category only grew at 0.5% p.a.over the ten years. That conceals a real mixed bag of fast growing emitters like Jet2 (11.6% p.a.) and airlines that have “done their bit” for the planet by ceasing to exist. Notable examples here include Air Berlin (3.8% of 2014emissions), Monarch (1.1%) and Thomas Cook (0.6%). Alitalia accounted for 2.9%of intra-Europe emissions back in 2024 - its successor ITA is one third smaller in terms of emissions, mainly driven by flying a lot less.
One of the big questions is whether total emissions would have been lower if Ryanair and Wizz had not grown so fast.Would other, perhaps less efficient, airlines have grown faster instead? Would some of the inefficient airlines that have gone out of business or been forced to shrink dramatically have been able to carry on as before?
It is impossible to know of course. But I suspect the answer is that total emissions would indeed have been lower. On the other hand, prices would have been higher and fewer people would have travelled. Most economists would say that would have been a worse outcome, provided that the full cost of emissions is being paid for. In the case ofRyanair and Wizz, there is a strong argument that this was the case. Their fast growth means that they’ve been paying for the vast majority of their carbon costs for a while now.
What about long-haul?
Long-haul flights came very close to being included in ETS when aviation came into the system in 2012. The biggest issue that prevented it was the difficulty of making non-European airlines pay forETS costs. If ETS costs were only imposed on European airlines, that would give their foreign competitors a big advantage. European airlines would be forced to shrink and overseas competitors would expand to fill the gap. Emissions wouldn’t fall but European companies and their employees would suffer. We’ve seen something like that play out on flights to Asia since the war in Ukraine, whereEuropean airlines are prevented from overflying Russia but their Chinese competitors are not.
Europe could in theory have imposed ETS costs on the airlines of other countries as a condition of flying to Europe. But theUSA threatened legal action to prevent it and other countries such as China exerted massive political pressure, for example threatening to cancel Airbus orders.
In parallel, a much more global emissions trading system called CORSIA had been developed with international involvement and buy-in. In the end the EU backed off in the hope that CORSIA would “fill the gap“. This was a case of kicking the can down the road and the question of whether ETS will be extended to cover long-haul flights is very much a matter of active debate currently.
My personal view is that I can’t see the US and Chinese objections are likely to have gone away and I also can’t think that the EU will be any more willing to risk a massive trade-war over the issue now than they were a decade or so ago.
The other thing I’d note is that if long-haul does come into ETS, there is a pretty big carbon leakage issue still to worry about, even if non-stop competitors have to pay for ETS. Taking a shortish hop from Europe to Istanbul or the Middle Eastern hubs before continuing your journey will save a customer a big slug of carbon costs. I don’t think the EU has ever had a good answer to that one.
There are many deficiencies of CORSIA and it certainly imposes lower carbon costs on airlines than the ETS, mainly because it only make airlines pay for growth in emissions. That should have the same incentive effect, but will raise less revenue. However, from a pragmatic perspective, I still think that making improvements to CORSIA is still probably the best path to a non-distortionary system that covers the global industry than trying to extend ETS.
Final thoughts
Other than the potential extension to long-haul, the biggest variable going forward for how ETS will affect aviation emissions in Europe is the price of emissions allowances. I’ve included a chart below which shows the recent history.
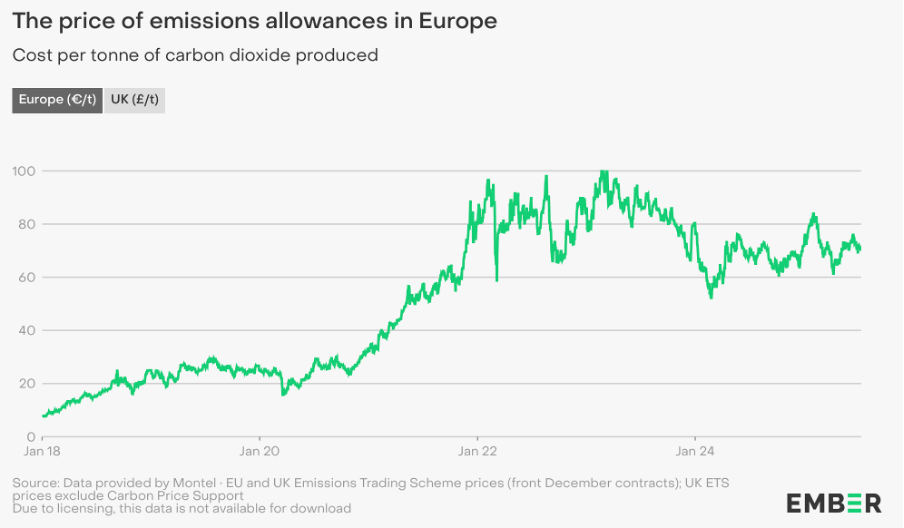
Despite increases since 2018, these prices are still fairly low compared to what many experts believe they should be to drive decarbonisation, and many forecast big increases over time. But that’s a prediction that’s been made many times before and the increase hasn’t really materialised so far. Aviation is a relatively small part of ETS overall, so prices are more driven by policies for energy and carbon intensive industries.
Nevertheless, for airline strategists, chief financial officers, and investors, the task of trying to predict the path of emissions costs and working out how best to mitigate the risks and position their airlines for competitive advantage in the new environment has risen rapidly up the agenda. The sharp increase in ETS costs, divergence in emissions trajectories, and varying intensity profiles all point to differing levels of exposure, adaptability, and transition readiness.
For some airlines, sustainability might once have been seen as a “box-ticking” exercise. For European airlines at least, that has long ceased to be the case as the financial costs and risks continue to escalate. For the most forward looking, it has become a top strategic issue where not only the risks but also the opportunities are being properly considered. Whatever the actual progress on fuel efficiency, that shift in perspective is perhaps the biggest thing to celebrate.
--
This article has been adapted from the original version published by Gridpoint Consulting